Submitted by Jenna Tomasello on
This is Part 1 of a three-part series on the CCRS Center’s State Work-Based Learning Initiative.
Where students live and learn can have a dramatic impact on their future education, employment, and life outcomes. Geographic information systems (GIS) can help state leaders use data to examine factors such as housing, health care, food, education, transportation, and employment that influence equity and opportunity gaps among students. Although GIS is not a new tool, a number of states are now exploring how GIS can be used to inform the design and implementation of their work-based learning (WBL) systems, including how to differentiate supports for schools and districts on the basis of their unique contextual needs. As part of the State Work-Based Learning Initiative, the CCRS Center is leveraging its expertise in behavioral and social science research, GIS, and technical assistance to support state education agencies as they work to develop high-quality WBL systems. This post provides a primer on how GIS can be used to inform WBL decision-making.
What Is WBL?
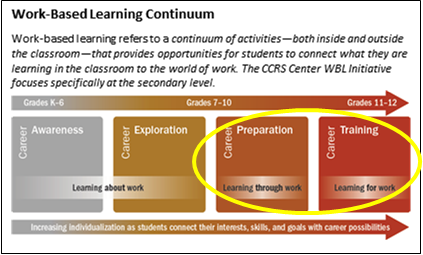
WBL is a “continuum of activities—both inside and outside the classroom—that provides opportunities for students to connect what they are learning in the classroom to the real world of work.” Quality WBL gives students the chance to develop critical skills for future careers by applying academic, career, and technical knowledge to workplace settings. States are increasingly designing, implementing, and scaling WBL as a strategy to improve career readiness for all students.
(For more information about using WBL as a strategy to support career readiness for all students, see this blog post.)
What Is GIS?
GIS is a tool designed to capture, display, analyze, and report spatial or geographic data, and it can be used to make equity-informed decisions. States can use GIS to analyze the spatial relationship between their K–12 education resources as well as their college and career resources, labor market demand, and employment accessibility. By layering these data, GIS enables states to see the relationship between different data sets across specific communities that have historically been looked at in isolation.
Using GIS to Promote More Equitable WBL Opportunities for Students
The ability to see large-scale, macroeconomic patterns provides a more holistic picture of the students and communities that states are charged with serving, and opportunities to promote WBL. According to Trent Sharp, senior technical assistance consultant with the CCRS Center, “GIS empowers state leaders by increasing their empathy and understanding for the people that they serve.” Based on insights drawn from GIS mapping, states can identify equity and opportunity gaps and use that information to inform how their initiatives and resources are coordinated, tailored, and deployed across diverse contexts within the state.
Colorado is one state that is using GIS maps for its WBL planning. In Colorado, the GIS maps layer data from secondary schools, districts, community colleges, universities, employer location, and labor market data. A cross-agency review of these maps revealed that, in some regions of the state, the high school career and technical education (CTE) programs offered did not align with industry need in the region. Using these insights, the CCRS team and staff from the Colorado Workforce Development Council and the Colorado Community College System are exploring strategies for using the mapping application to focus conversations between intermediaries, K-12 education, higher education and labor.
However, Sharp cautioned that there is danger in oversimplifying what GIS mapping reveals. “GIS is particularly well-suited for sharing the complexity of a particular context, but we don’t want to be overwhelmed by how big an issue can seem. We might not figure out how to collaborate across the whole state right away, but let’s work together to figure one thing out in this particular location and then apply what we learned more broadly.”
Recently, Colorado has used GIS maps to focus on specific regions in the state and to use that information to inform larger WBL system decisions. For example, the state has used GIS maps to identify equity and opportunity gaps in specific rural areas that have limited broadband internet access and are geographically isolated from large employers. This has led the state to think creatively about differentiating its WBL system supports in rural areas by creating opportunities for virtual engagement and simulation. This support will give all students access to a range of in-demand industries and provide opportunities to develop crucial academic, technical, and employability skills for those industries.
Considerations for States Interested in Using GIS to Inform WBL Decisions
To leverage GIS in a way that promotes equitable access to WBL, it is important for states and districts to also engage people on the ground. As Sharp explained, “If our goal is intervening in entrenched inequitable outcomes, then we need spatial analysis, but it has to be coupled with a more community-centered engagement that is inclusive of the realty on the ground.” More participatory GIS could involve engaging the community in decision-making processes and generating additional data. Eventually GIS could be used to direct state-level policy and inform local WBL policies alongside the communities affected. The following are additional considerations drawn from a new CCRS Center GIS Essential Questions tool for states interested in using GIS to inform WBL decisions. This resource poses these three essential questions and a series of additional probing questions that states can explore using GIS mapping:
- How are WBL resources and services distributed within a state?
- How well are WBL resources aligned across the state?
- What socioeconomic factors impact WBL opportunities for students?
GIS can be used to holistically understand the complexity of communities and create more equitable opportunities for students. Although GIS provides a better way to visualize data to confront spatial inequality and solve important WBL questions, it is insufficient by itself. For states looking to improve their WBL systems, GIS mapping paired with authentic community engagement can be used to inform WBL policy and practice decisions that enable conditions that can increase WBL opportunities for all students.
Jenna Tomasello is a Policy Associate at the American Youth Policy Forum.
Add new comment